
TL;DR: Growth Mapping is a research-backed framework that replaces “post more content” with a closed loop: Sense what is true about your business, Seize the one move most likely to improve it, Transform by measuring the result, and repeat. It runs on three operational domains (the 3Rs: Recruitment, Retention, Revenue) and ranks each possible move against three outcome levers (the 3Ps: Profit, Potential, People). The full academic paper lives at /papers/growth-mapping.
What is Growth Mapping
Growth Mapping is a goal-driven approach to marketing growth for small and mid-size businesses. It starts with a single premise: marketing activity is not marketing progress. You can publish, post, and run ads without moving revenue, clients, or profit by a single dollar.
Growth Mapping replaces activity-tracking with a continuous loop — Sense, Seize, Transform — drawn from dynamic-capabilities theory (Teece, 2007) and applied to the practical reality of the sub-20-employee business. The loop is organized across three operational domains (the 3Rs) and ranked by three outcome levers (the 3Ps). The result is a map: a clear picture of where your business is, where it should go, and which move to run next.
The framework is the intellectual spine of the Hiilite Agentic Advisor and the subject of ongoing doctoral research at UBC-Okanagan. The full paper is at /papers/growth-mapping.
The Loop: Sense, Seize, Transform
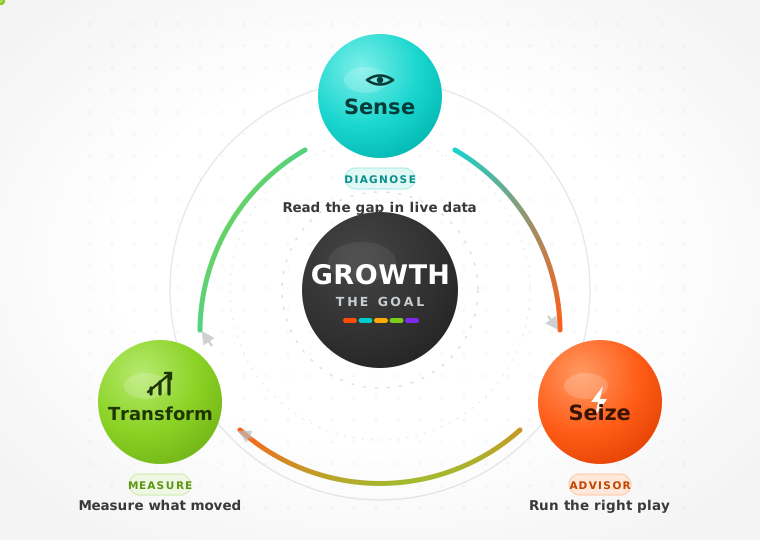
The loop has three stages. Each one feeds the next. There is no end state — only a tighter cycle.
Sense
Read the gap between where the business is and where it needs to be. This means actual data: revenue, clients, cost-to-serve, web traffic, search visibility, pipeline. Not a dashboard that shows what happened last month — a diagnosis that tells you what is true right now. The Sense stage asks: what is actually going on in this business?
The clinical analogy is deliberate. A physician does not read one vital sign and call it a diagnosis. Growth Mapping reads multiple signals in combination — financial, marketing, operational — and identifies the gap before prescribing a move.
Seize
Once the gap is clear, choose the play most likely to close it. This is where growth-hacking taxonomy meets strategy (Bohnsack & Liesner, 2019): a structured set of tested, repeatable moves — plays — each mapped to an outcome domain and ranked by projected impact against the 3Ps rubric (below). Seize answers: what is the right move, and in what order?
The platform’s Advisor agent runs this step on demand. It reads the Sense output and surfaces the top-ranked plays with an explanation of the reasoning.
Transform
Run the play. Measure what moved. Feed the result back into the next Sense cycle. Transform closes the loop: it is the step that separates a recommendation engine from an outcome engine. Without it, you have good advice. With it, you have a system that learns.
The 3Rs: The Operational Domains
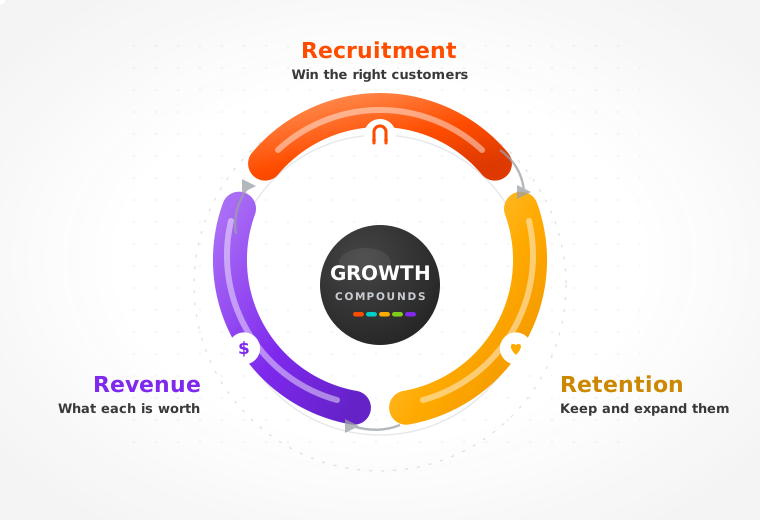
The 3Rs divide the marketing challenge into three distinct domains. Every play, every KPI, and every goal on the platform maps to one of them.
Recruitment
How customers find the business, trust it, and choose it. This includes search, paid channels, referral, and all forms of acquisition. Plays in this domain include SEO, content, paid ads, and referral loops. The full guide is at /guides/recruitment.
Retention
How customers are onboarded, served, and kept. Acquisition is expensive. Retention is where the margin lives. Plays in this domain include onboarding improvements, client communication systems, and churn-reduction experiments. The full guide is at /guides/retention.
Revenue
How the business makes money from the customers it has and keeps. This includes pricing, lifetime value, upsell, and the relationship between client revenue and what it costs to serve them. The full guide is at /guides/revenue.
The 3Ps: How We Rank Which Move to Run Next
Not all plays are equal. At any given moment, dozens of marketing moves are technically available. The 3Ps rubric is how you decide which one is worth running now.
Each candidate play is assessed against three levers:
Profit — Will this move improve the relationship between what a client pays and what it costs to serve them? Plays that improve profitability rank above plays that only improve vanity metrics.
Potential — What is the upside if this works? Small improvements to high-volume channels beat large improvements to low-volume ones. Potential adjusts for magnitude.
People — Does the team have the capacity and capability to run this play well, and does the culture support it? A technically correct play executed poorly is worse than a simpler play executed cleanly.
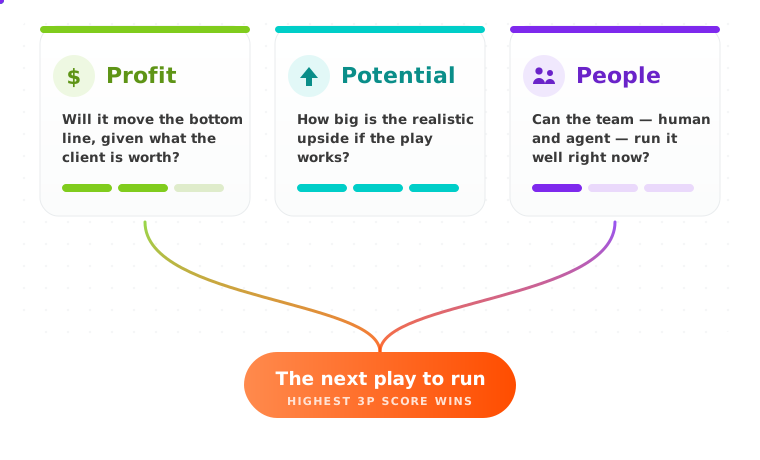
Run the play that scores highest across all three. That is the next move.
The Growth Map
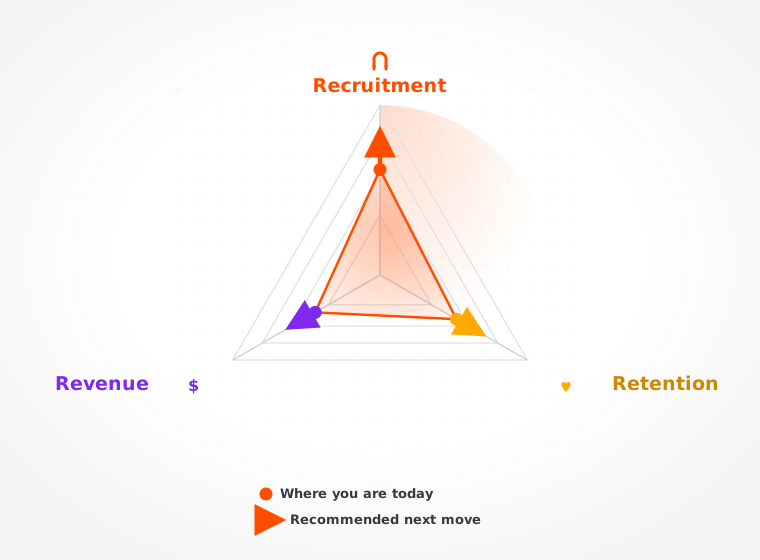
The Growth Map is the visual output of the framework. It plots a business’s current KPIs against its goals, with directional vectors showing which moves are likely to close the distance fastest. Each vector maps to a specific play in the 3R domain it affects.
The map answers one question: given where you are right now, what moves the needle most? The Hiilite platform generates this automatically from connected data. The interactive public version is coming to /tools/growth-map.
The Moat: A Closed Loop on Real Financials
Most tools stop at the dashboard. They show what happened. Growth Mapping closes the loop by binding recommendations to the client’s actual financials — QuickBooks revenue, time-tracked cost, CRM pipeline — not generic benchmarks.
This matters because the 3Ps rubric requires real numbers. You cannot rank plays by profitability if you do not know what a client is worth. You cannot measure Transform if you are not tracking what moved. The loop only works when it is grounded in data that is specific, current, and financial.
Your report knows what each client is worth. That is the structural advantage no reporting tool can claim.
Read More: The P1 Cluster
These spokes extend the framework in depth. Each one links back here.
| Article | Angle | Link |
|---|---|---|
| What is Growth Hacking, Really? | Separates signal from noise on a widely misused term | /blog/what-is-growth-hacking |
| The 3Rs: Recruitment, Retention, Revenue | The operational breakdown in full | /blog/the-3rs |
| The 3Ps: Which Growth Move to Run Next | How to rank any play against Profit, Potential, People | /blog/the-3ps |
| Dynamic Capabilities for the 20-Person Company | Teece’s theory applied to SME reality | /blog/dynamic-capabilities |
| Why Unicorn Growth Tactics Fail for SMEs | The small-business problem and what actually transfers | /blog/why-unicorn-tactics-fail |
Related Papers
- The Growth Mapping Paper — the full academic treatment of the framework, with literature review, construct definitions, and the 20-SME research design.
- The Agentic Agency — how the loop is built into the Hiilite platform and why the operating model it creates is different from every other agency tool.
Frequently Asked Questions
What is Growth Mapping, in plain terms? It is a system for deciding which marketing move to run next, based on what your business data actually shows — not gut feeling and not generic best practice. It uses a three-stage loop (Sense, Seize, Transform) and a three-domain taxonomy (Recruitment, Retention, Revenue) to organize the whole marketing challenge in one place.
Is this just growth hacking rebranded? No. Growth hacking describes a mindset and a loose set of tactics (Ellis coined the term in 2010). Growth Mapping is a structured framework that sits one layer above: it uses a growth-hacking taxonomy to populate the Plays catalog, but it adds a ranking system (the 3Ps), an outcome loop (Sense/Seize/Transform), and a financial moat that pure growth-hacking frameworks lack. For the full comparison, see /blog/what-is-growth-hacking.
Where does the academic grounding come from? The Sense/Seize/Transform loop maps directly to Teece’s (2007) dynamic-capabilities microfoundations (sense / seize / reconfigure). The plays taxonomy draws on Bohnsack and Liesner’s (2019) growth-hacking typology. The framework is the subject of William Walczak’s doctoral research at UBC-Okanagan under Dr. Eric Li. See the full paper and the references below.
Can a small business use this without the platform? Yes. The framework itself is free and public. The 3Rs guide, retention guide, and revenue guide each give you the model for that domain in full. The platform automates the Sense stage — pulling real data so you do not have to assemble it manually — but the loop can be run with a spreadsheet and discipline.
How is this different from a marketing dashboard? A dashboard is read-only. It shows what happened. Growth Mapping is prescriptive: it tells you what to do next. The difference is the Seize stage and the 3Ps ranking system. No dashboard tells you which play to run. See The Agentic Agency for the full argument.
References
- Teece, D. J. (2007). Explicating dynamic capabilities: The nature and microfoundations of (sustainable) enterprise performance. Strategic Management Journal, 28(13), 1319–1350. https://doi.org/10.1002/smj.640
- Bohnsack, R., & Liesner, M. M. (2019). What the hack? A growth hacking taxonomy and practical implications for firms. Business Horizons, 62(6), 795–806. https://doi.org/10.1016/j.bushor.2019.09.001
- Teece, D. J. (2018). Business models and dynamic capabilities. Long Range Planning, 51(1), 40–49. https://doi.org/10.1016/j.lrp.2017.06.007
- Porter, M. E. (1996). What is strategy? Harvard Business Review, 74(6), 61–78. https://hbr.org/1996/11/what-is-strategy
Work with Hiilite
The framework is public. The platform runs it automatically against your real data.
If you want to know what is actually going on in your business and which marketing move to run next, there are two ways in.
Book a discovery call — a 30-minute conversation about your goals, your numbers, and whether the platform is the right fit.
Explore the platform — see the Sense/Seize/Transform loop in action on a real client account.
About the Author
William Walczak, MBA is the CEO of Hiilite Creative Group (2014–present) and a PhD candidate in Interdisciplinary Graduate Studies at UBC-Okanagan, where his research focuses on growth hacking, dynamic capabilities, and marketing performance for SMEs. He was named CEO Monthly Marketing Strategy CEO of the Year 2023 (BC) and Kelowna’s Daily Courier Top 40 Under 40. His peer-reviewed work includes Walczak, W., Li, E. P. H., & Nelson, S. (2024), “Logarithm: A Cinematic Exploration of Time,” Journal of Customer Behaviour.
hiilite.com/team/william-walczak · LinkedIn · Google Scholar